The global digital asset market is experiencing a severe trial as the flagship cryptocurrency faces intense selling pressure. Investors logging into their portfolios are greeting a stark reality: the bitcoin price down today trends have materialized into a harsh reality, forcing the asset below the psychologically critical $60,000 support level.
This sudden correction has sent shockwaves through the entire decentralized finance (DeFi) ecosystem, leaving both retail and institutional traders wondering if this is a temporary pullback or the beginning of a prolonged macro downtrend. Bitcoin has shed roughly 27% of its value since the start of 2026, pushing it down over 50% from its historic all-time high of $126,000 achieved in late 2025.
To understand why the bitcoin price down today narrative is dominating financial headlines, we must analyze a perfect storm of macroeconomic shifts, unexpected institutional actions, and critical on-chain metrics that are redefining market structures.
1. Why Is the Bitcoin Price Drop Happening? The Core Catalysts
When analyzing a bitcoin price drop, it is rarely driven by a single isolated event. Instead, the current market environment is the result of compounding negative factors that have simultaneously eroded investor confidence.
The Fed, Inflation, and Geopolitical Strain
A primary macro driver behind the recent bitcoin price fall is the ongoing geopolitical conflict in the Middle East, specifically the U.S.-Iran tensions. This conflict has consistently driven up global crude oil prices, which directly impacts corporate transportation and production costs.
As a result, sticky inflation has forced Federal Reserve officials to delay highly anticipated interest rate cuts. In fact, hawkish commentary from central bankers suggesting potential interest rate hikes has triggered a massive deleveraging event across both traditional equities and risk-on digital assets.
The Institutional Narrative Shatters
For years, the foundational bull case for Bitcoin was built on the thesis that institutions would act as ultimate diamond hands. However, two seismic events in early June shattered this market psychology:
- The First Strategy Sale: Market reports revealed that Strategy Inc.—historically the most aggressive corporate accumulator of Bitcoin—divested a small portion of its holdings. Even though the company quickly moved to steady nerves by buying back a much larger share ($101 million vs. $2.5 million sold), the psychological damage was done. The “never sell” narrative was broken.
- Massive Spot ETF Outflows: Wall Street has transformed from an aggressive buyer into an equally aggressive seller. U.S. spot Bitcoin ETFs experienced their largest capital flight on record, witnessing over $3.4 billion in net outflows within a single week. High-profile funds like BlackRock’s IBIT logged consecutive days of heavy redemptions, accelerating the velocity of the price drop.
2. Technical Analysis: Key Support Levels and Indicators
From a pure technical market perspective, Bitcoin’s breakdown into sub-$60K territory highlights an exhaustion of buyers. Below, we break down the critical indicators that senior traders are watching to determine if a market bottom is near.
Critical Support and Resistance Zones
Bitcoin recently retested its vital February low, touching an intraday bottom of $59,110.90.
- Immediate Support ($58,500 – $60,000): This is the ultimate line in the sand for bulls. Historically, this region attracted heavy institutional bargain hunting. If this zone fails to hold on a weekly closing basis, the doors open to a deeper correction toward the mid-$50,000 macro range.
- Local Resistance ($64,200 – $65,000): For the trend to shift back to neutral or bullish, Bitcoin must reclaim the $65,000 level, which acted as a launching pad throughout early spring before converting into a overhead supply zone.
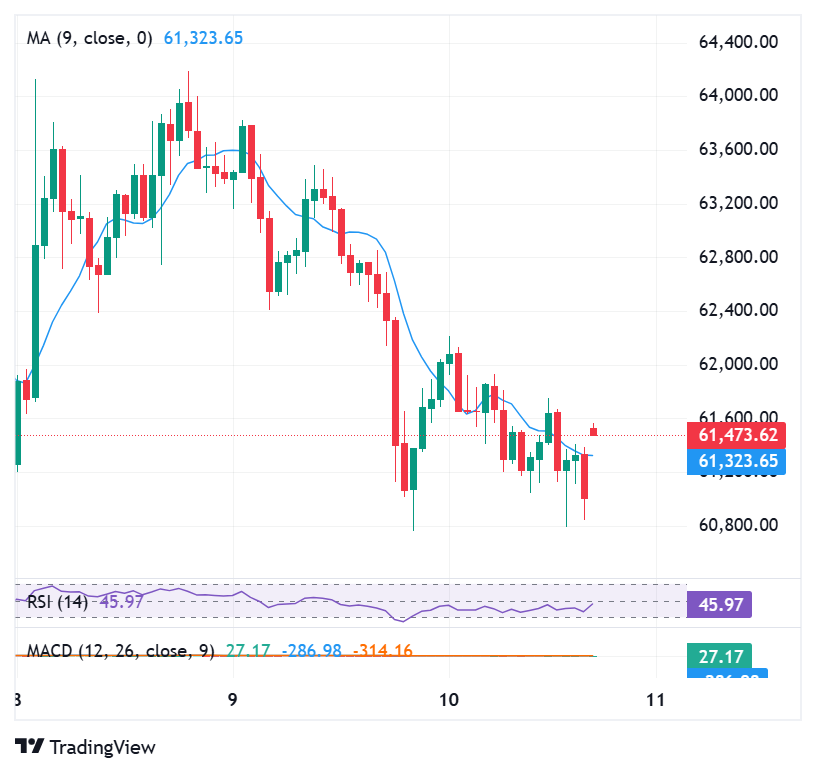
Momentum Indicators: RSI and Miner Capitalization
Despite the grim price action, technical oscillators are flashing classic capitulation signals that often precede a trend reversal:
- Relative Strength Index (RSI): The daily RSI has plunged to an extreme low of 18. In technical analysis, any reading below 30 indicates an asset is deeply oversold. An RSI of 18 is a rare historical occurrence, suggesting that the selling momentum may be overextended in the short term.
- The Crypto Fear & Greed Index: Sentiment has bottomed out into Extreme Fear with a reading of 20.
- Miner Capitulation Costs: On-chain data from major mining pools shows that daily net profits for prominent rigs (such as Antminer and Whatsminer) have turned negative. When market prices hit the baseline production cost of a Bitcoin, it typically triggers a washout of inefficient, small-scale miners, historically marking a structural market floor.
3. On-Chain Data and Capital Rotation: The Growth of Competitors
A deeper look at the blockchain itself reveals a fascinating divergence in capital allocation. While Bitcoin experiences heavy distribution, capital isn’t entirely leaving the digital asset space; it is rotating.
Capital Diversion to AI and Alternative Tokens
While Bitcoin struggles with structural frailties, speculative retail and institutional capital is actively shifting toward booming AI stocks and the highly anticipated SpaceX IPO. Concurrently, a fundamental shift is happening within Web3.
DeFi investors are prioritizing platforms that generate real protocol revenue and cash flow over simple store-of-value narratives. For example, Hyperliquid’s HYPE token has defied gravity, surging 160% year-to-date and achieving an all-time high of $75.52 in June 2026, supported by Grayscale and 21Shares ETF products.
| Metric / Asset | Bitcoin (BTC) | Hyperliquid (HYPE) |
| Current Trend | Bearish (Down 27% YTD) | Bullish (Up 160% YTD) |
| Market Driver | Macro headwinds / ETF outflows | Protocol revenue / Utility |
| Key Support | $59,110 | $68.00 |
| Daily RSI | 18 (Extremely Oversold) | 62 (Neutral-Bullish) |
4. The Bull vs. Bear Case: What Lies Ahead?
To maintain a balanced, objective view of the market, investors must weigh both the immediate risks and the broader long-term framework.
The Bear Case (More Pain Ahead)
The bearish outlook relies on structural shifts in market liquidity. If the Federal Reserve maintains a higher-for-longer stance on interest rates, the yield on risk-free assets like U.S. Treasuries remains highly attractive, continuously starving speculative markets of liquidity. If institutional spot ETF outflows do not stabilize, the constant selling pressure could easily force a cascading liquidation event through automated DeFi lending protocols, dragging BTC down to test the $52,000 macro liquidity pocket.
The Bull Case (The Capitulation Bounce)
Conversely, the bullish perspective looks at historical market cycles. Periods of maximum pessimism, combined with an RSI deep in oversold territory (18) and miners reaching shutdown prices, have consistently marked the twilight of a correction. Furthermore, on-chain analytics show that long-term whale wallets (holding 1,000+ BTC) have quietly slowed down their selling over the last 48 hours. If geopolitical tensions cool down and inflation shows signs of easing, a massive short-squeeze could easily propel Bitcoin back above $65,000 in a matter of days.
Conclusion: Navigating the Volatility
The fact that the bitcoin price down today charts are printing red can be unsettling, but it represents a classic market-clearing event. The unwinding of overleveraged long positions, combined with macroeconomic headwinds and an institutional shift in narrative, has forced a healthy albeit painful correction.
For long-term participants, the current data suggests that while the short-term outlook remains highly volatile and dependent on macro data, the asset is approaching deeply discounted historical valuation areas. Monitoring the $60,000 support level and tracking whether ETF redemptions begin to slow down will be your most reliable compass in the coming weeks. Stay grounded, manage your risk parameters, and remember that blockchain utility continues to develop regardless of temporary price fluctuations.

Henry Cross is a dedicated crypto writer and market researcher with over a decade of hands on experience in blockchain and digital assets. He focuses on simplifying complex topics while tracking fast moving trends across Bitcoin, altcoins, and emerging Web3 ecosystems. His work aims to help both new and experienced investors make informed decisions through clear analysis and practical insights.
Henry currently contributes to leading crypto platforms, where he delivers market breakdowns, price outlooks, and educational content. Over the years, his articles have appeared on several well known crypto media sites, building a reputation for reliable and easy to understand reporting. Alongside his writing, he shares beginner friendly guides and learning resources for readers who want to explore crypto without confusion.